Trap Statistics UK Greyhounds: Track-by-Track Trap Bias Data
Best Greyhound Betting Sites – Bet on Greyhounds in 2026
Loading...
Trap statistics reveal one of greyhound racing’s most consistent patterns: where a dog starts significantly affects where it finishes. Unlike horse racing where draw positions matter only on certain courses, greyhound racing produces measurable trap biases at virtually every venue. Understanding these patterns provides an analytical edge that many casual punters overlook.
The data is publicly available and updated regularly. SIS publishes trap wins statistics across more than 15 UK tracks, providing percentages that show how often each starting position produces winners. These figures deviate from the theoretical 16.67% that would apply if all six traps won equally, sometimes dramatically so.
This guide explains what trap statistics measure, how they vary across British tracks, and how to incorporate them into race analysis. The goal is not to make traps your only selection criterion, but to ensure you understand their influence rather than ignoring a factor that demonstrably affects outcomes.
What Are Trap Statistics
Trap statistics express how often each starting position wins races at a given track over a specified period. If trap one wins 20% of races while trap six wins 12%, that eight-point difference represents a substantial bias. Over hundreds of races, these percentages stabilise into reliable patterns that reflect genuine track characteristics.
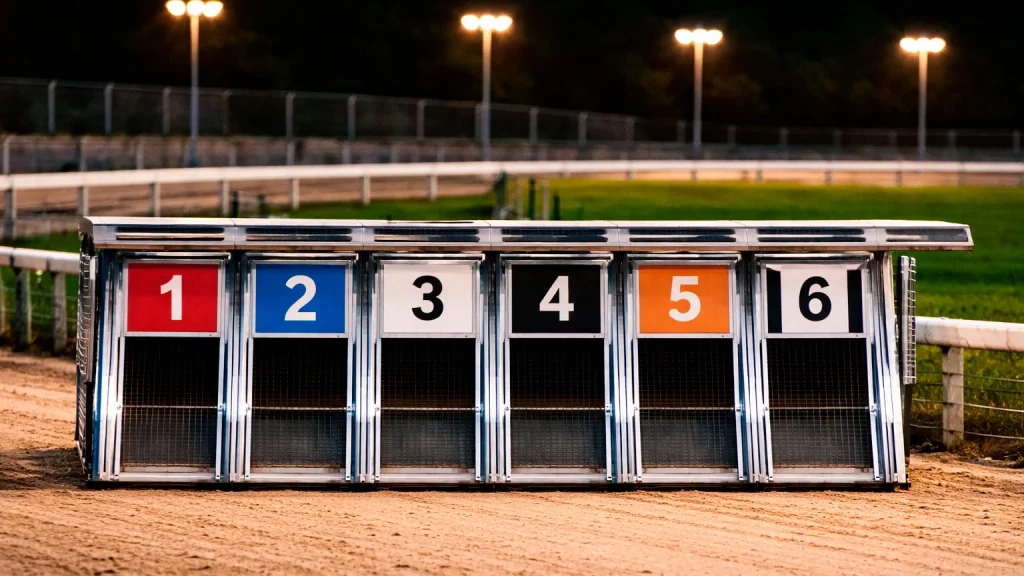
Standard greyhound races feature six traps numbered one through six, positioned from the inside rail outward. Trap one sits closest to the inside, offering the shortest route around bends. Trap six sits widest, requiring runners to cover more ground but potentially avoiding early crowding.
The baseline expectation assumes random distribution. With six traps, each should theoretically win one-sixth of races, or 16.67%. Any persistent deviation from this figure indicates bias. Trap statistics quantify these deviations, showing exactly how much certain positions over or underperform expectations.
Sample size matters enormously. Statistics based on twenty races mean little because random variation overwhelms any real pattern. Statistics based on several hundred races reveal genuine tendencies. The best trap data sources publish figures accumulated over substantial periods, typically a full year or more.
Trap Bias by UK Track
The 18 GBGB-licensed tracks each produce distinct trap patterns shaped by their individual configurations. No universal rule applies across all venues, which makes track-specific research essential rather than optional.
Inside traps generally outperform at tracks with sharp first bends. When greyhounds break from traps and immediately encounter a tight turn, trap one runners gain an advantage by reaching the rail first and taking the shortest path. Tracks like Romford historically show this inside-rail bias, with trap one winning above expectation.
Wide-running tracks produce different patterns. Some venues have sweeping bends and generous running widths that reduce the inside-rail advantage. At these tracks, trap six runners avoid early crowding and maintain cleaner runs to the first bend. Middle traps sometimes perform best when both extreme positions carry risks.
Distance affects trap performance within the same track. Sprint races over shorter trips may favour fast-breaking inside runners who establish early leads. Staying races over longer distances give wide runners more time to overcome positional disadvantages, potentially reducing trap bias or shifting it toward outside positions.
Recent track modifications alter historical patterns. When venues resurface running lines, adjust trap positions, or reconfigure bends, previous statistics become less reliable. Following track announcements and noting when changes occur helps identify periods where historical data may not apply.
Seasonal conditions introduce temporary variations. Wet weather softens sand and may affect how different running styles perform. Some tracks drain better than others, and trap biases can shift during particularly wet or dry periods. Long-term statistics smooth these variations, but short-term conditions still matter.
How Track Configuration Affects Traps
The distance from traps to the first bend determines how much time greyhounds have to establish running positions before the track narrows. Short runs to bends compress the field quickly, amplifying the importance of trap draw. Longer runs allow more natural sorting based on early pace rather than starting position.
Bend angles vary considerably across British tracks. Sharp bends favour inside runners who have less ground to cover. Sweeping bends reduce this advantage by allowing wider runners to maintain momentum rather than checking their stride. The geometry directly translates into trap performance differences.
Track circumference affects how many bends a race includes. Standard races at smaller tracks may feature four or more bends, multiplying the cumulative advantage of inside running. Larger tracks with fewer bends per race reduce total bend-related disadvantage for wide runners.
Running surface consistency matters at the micro level. If the inside rail becomes churned or uneven through heavy use, the theoretical shortest path may not be the fastest path. Experienced trainers sometimes note that middle tracks offer better going than heavily trafficked rails.
Trap machinery and its maintenance affect break consistency. Well-maintained traps release greyhounds evenly, while worn mechanisms may cause slight delays or advantages for specific positions. These mechanical factors typically balance over time but can create short-term anomalies.
Using Trap Data in Selections
Trap statistics inform selections without determining them. A greyhound with poor recent form does not become a good bet simply because it draws a favourable trap. Conversely, a strong runner from an unfavourable trap remains worthy of consideration. The data adjusts probability assessments rather than overriding other factors.
Comparing trap statistics with individual greyhound trap records reveals whether a runner suits its draw. A dog with strong form from trap one at a track where trap one overperforms combines two positive factors. A dog with weak trap one form at the same track presents conflicting signals requiring judgement.
Market prices partially incorporate trap bias. Professional bettors and bookmakers understand these patterns, so prices generally reflect trap advantages and disadvantages. Finding value requires assessing whether the market has fully accounted for trap position, not simply identifying which traps win most often.
Pace analysis interacts with trap data. If several early-pace greyhounds draw adjacent inside traps, they may interfere with each other while an outside closer runs freely. Trap statistics alone miss these race-specific dynamics that depend on the particular runners assembled.
Maintaining Perspective on Trap Statistics
Trap bias represents one input among many. Greyhound ability, recent form, trainer performance, and race dynamics all influence outcomes more directly than starting position. The best approach treats trap data as a modifier that adjusts assessments based on form rather than a primary selection method.
Statistics describe probabilities, not certainties. A trap that wins 22% of races still loses 78% of the time. Expecting trap bias to guarantee results misunderstands what the numbers actually mean. The edge is real but modest, and it compounds over many bets rather than guaranteeing individual outcomes.
Keeping updated with current statistics prevents reliance on outdated patterns. Tracks evolve, maintenance practices change, and what applied last year may not apply this year. Regular consultation of published trap data ensures your analysis reflects current conditions rather than historical assumptions.
Trap statistics offer a legitimate analytical tool that requires proper context to use effectively. They confirm that starting position matters, quantify how much it matters at each venue, and provide actionable data for adjusting selections. Integrated with form analysis and race reading, trap awareness improves the quality of betting decisions across British greyhound racing.